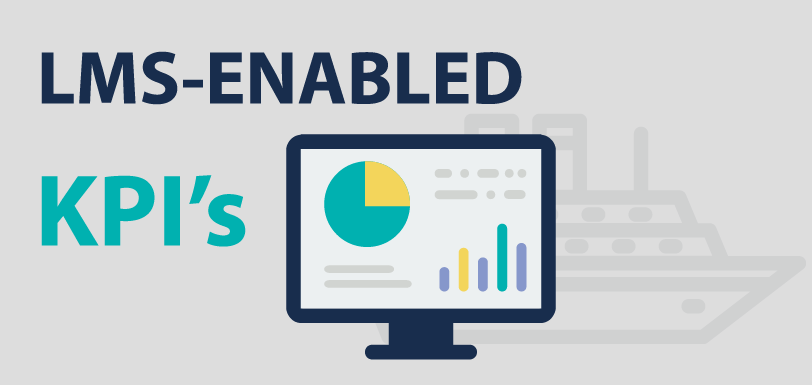
LMS-Enabled KPIs for Maritime Training
Oct 27, 2016 Murray Goldberg 0 Continuous Improvement, Maritime TrainingIntroduction
Continuous Improvement (or CI) is the process of continually analyzing the performance of an aspect of operations, and then applying changes to improve it. This is the third and final part in a blog series on using CI to improve your maritime familiarization training. Implementing a modest CI process for your in-house training can be simple. Even a small program can produce a tremendous return in safety, efficiency, trainee engagement and satisfaction.
The first article of this series provided an overview of CI, why it is important for maritime training, and introduced Key Performance Indicators (KPIs). The second article covered useful training-related KPIs which you can implement without a learning management system (LMS).
This last article completes the series by talking about KPIs which are likely to be available to you if you employ an LMS. These KPIs provide deep insight into learning activities and performance, and can be used as part of the foundation upon which you implement continuous improvement.
Quick Review
If the first two articles in this series are fresh in your mind, please feel free to skip to the next section. Otherwise, read on for a quick refresher:
CI is the continuously repeating process of reflecting on some activity (training in our case) and eliminating sub-optimal practices in a series of incremental steps. In the maritime training environment, the focus of CI should be on improving the effectiveness of training foremost, with a secondary focus on improving efficiency.
This topic is especially timely right now. Vessels, equipment and job routines continue to become more complex and sophisticated. Deeper knowledge and more specialized skills are required to operate vessels safely. However, familiarization training in most organizations has not changed much over the years. There is an increasingly large gap between operational training and the knowledge needs of modern seafarers. A program of continuous improvement for training can help close this gap.
Key Performance Indicators
Key Performance Indicators (KPIs) are the foundation of any CI process. KPIs are measurements used to evaluate effectiveness and efficiency. This is critical – unless you have a way of measuring whether the changes made have created an improvement, you’ll have no way of telling whether you are moving closer to your goal. KPIs provide that information by measuring the success of every change you make.
As a reminder, KPIs should satisfy the following requirements:
- They must be aligned with corporate goals.
- They should react reasonably quickly to changes in training.
- They must track something that is actually “measurable”.
- They must track something you have some control over.
LMS-Enabled KPIs
Technology is your friend here. If aspects of your training activities are managed with a computer-based learning management system (LMS), you can use it to report on learning process metrics which cannot otherwise be practically obtained. In fact, metrics are one of the greatest benefits of using an LMS.
Before we discuss the metrics, it is important to have a basic understanding of what an LMS is. Here is an edited definition from Wikipedia:
A learning management system (“LMS”) is a software application for the delivery, management, tracking, and reporting of training and assessments. A robust LMS should be able to: assemble and deliver standardized training content rapidly; consolidate training initiatives on a scalable web-based platform; personalize content and enable knowledge reuse; and centralize and automate training administration.
Note the emphasis on “management, tracking and reporting”. This is what we are concerned about with CI. However, from the trainee and trainer perspective, the LMS is more about delivery of learning materials and assessments.
The KPIs
Let’s take a look at some of these “LMS-enabled KPIs” and discuss how they can be used in a process of continuous improvement:
Individual Exam Question Metrics
LMSs can be used to deliver exams, and while doing so, are able to record various kinds of metrics.
I find per-question statistics to be the most compelling. An LMS can generate metrics on how often each question is correctly answered. Some will even indicate the distribution of answer choices for each question. This is outstanding information as it highlights hidden weaknesses in your training. For example, perhaps in general your trainees are passing exams with flying colors. However, they may routinely be incorrectly answering a small set of important questions, critical to safe operations. This could represent a real risk to safety or operational efficiency. Without an LMS, this information would be very difficult to uncover on an organization-wide basis.
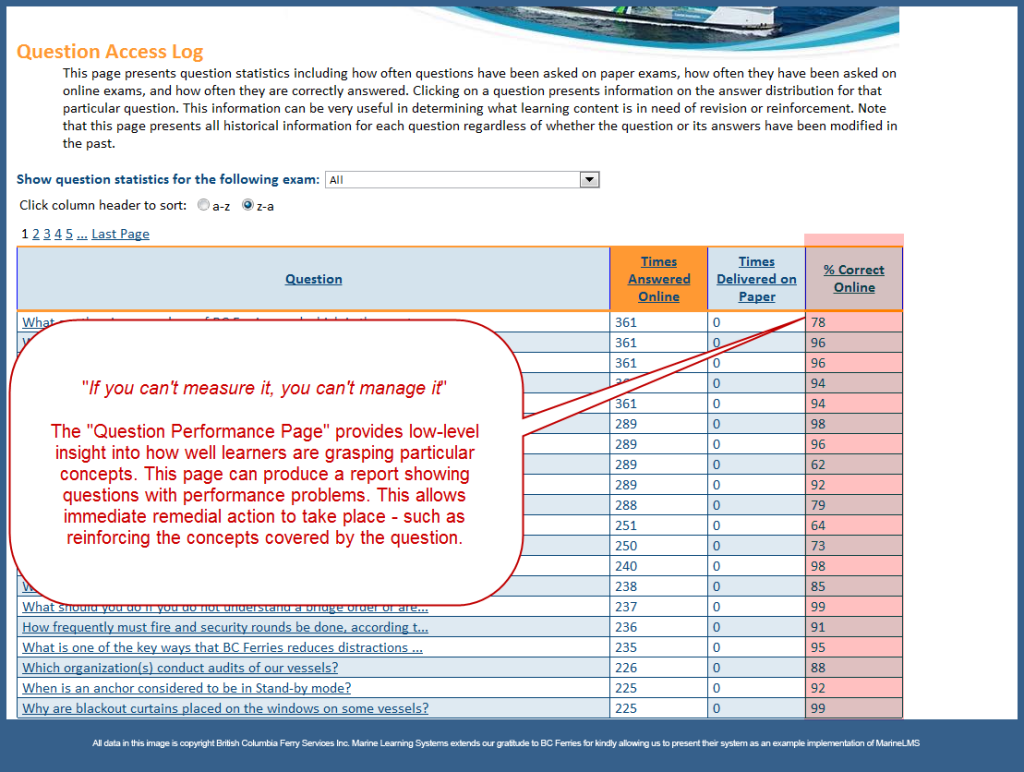
Question Access Log
What do you do if there are questions which are routinely answered incorrectly? First – determine whether the question itself is incorrectly worded or ambiguous. If that’s the case, then you simply need to fix the question. However, if the question looks acceptable, the problem likely lies in the learning materials or training program. The next step, if your LMS supports it, is to look at the distribution of answers. Is there one incorrect answer that most candidates are choosing? Or are the incorrect answers uniformly distributed among the choices? The distribution metric can help you identify common misunderstandings and help in updating the learning materials.
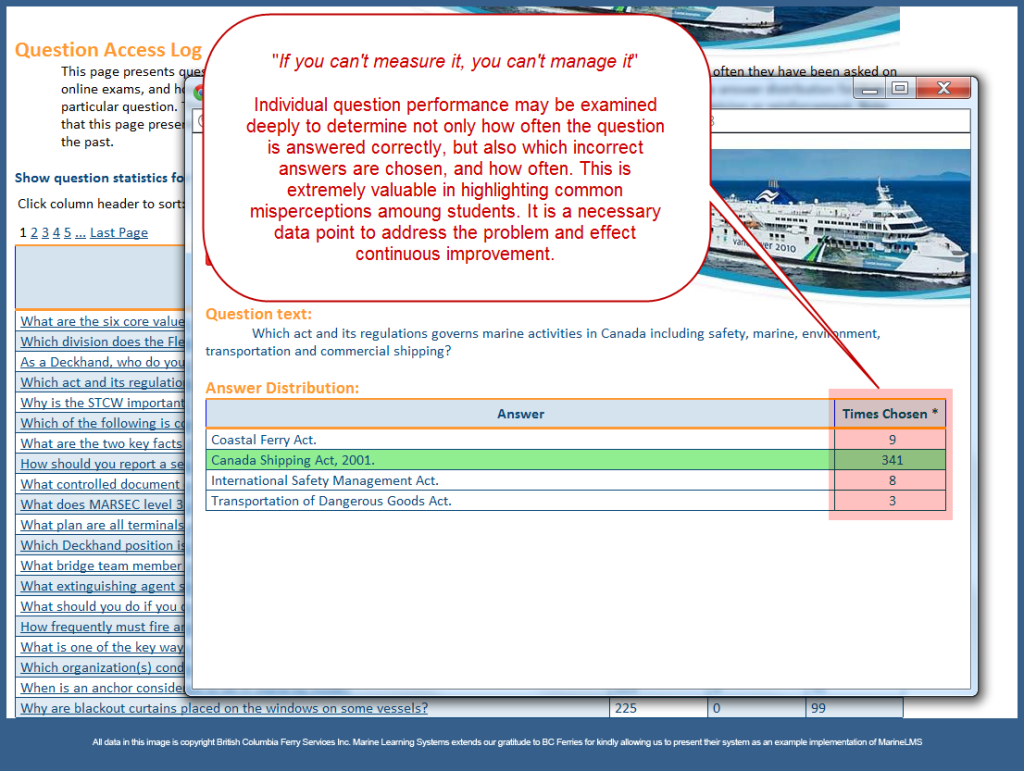
Answer Distribution Report
In either case, this metric is useful at uncovering hidden training issues, allowing you to correct them before they result in a loss.
Learning Content Access Metrics
One of the most informative metrics delivered by many LMSs is the learning page access log. This metric indicates how long, on average, learners are spending on every learning page.
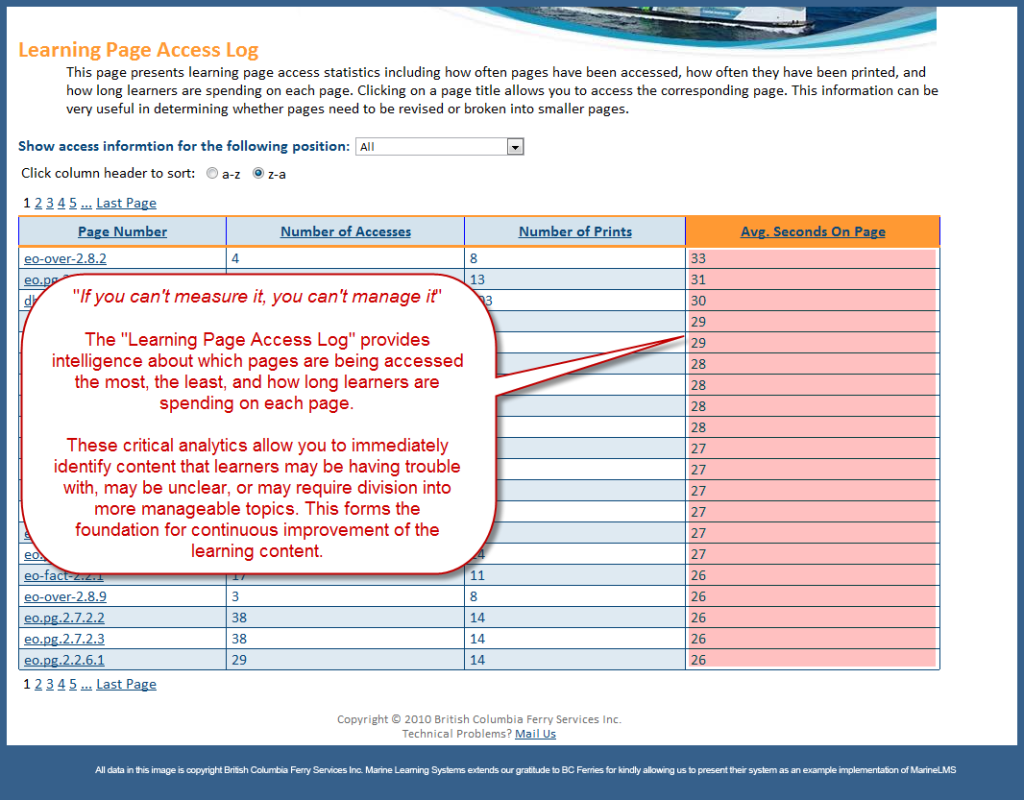
Learning Page Access Log
Trends in this number can be watched to determine whether your overall training time expectations are valid. They can also alert you to changes which could be caused by candidate differences or changes in the training materials.
More importantly, this metric can be used to identify pages whose access times represent outliers. For example, let’s say most learning pages take 30 seconds to one minute for trainees to complete. However, there are a small number of pages at 10 seconds, and another group at three minutes. This could be an issue which needs attention.
If the page access duration is unusually short, the content there may not be useful or compelling. Visiting that page and speaking with some trainees will usually make it immediately clear whether there is a problem. and if there is, how it can be resolved.
More telling are pages whose average time on page is unusually high. Typically these pages contain content which is complex or confusing to learners. These pages often require attention to either break up the content, or to provide more digestible explanations.
Whatever the results, the LMS provides a window of insight into how trainees use the learning materials. This is a great example of how technology can be our friend when analyzing training activities for continuous improvement.
Overall Exam Performance Metrics
Another metric that is easily generated by most LMSs is the overall exam performance. Although you can maintain this metric without technology, an LMS does the work for you and presents tidy and flexible reporting options.
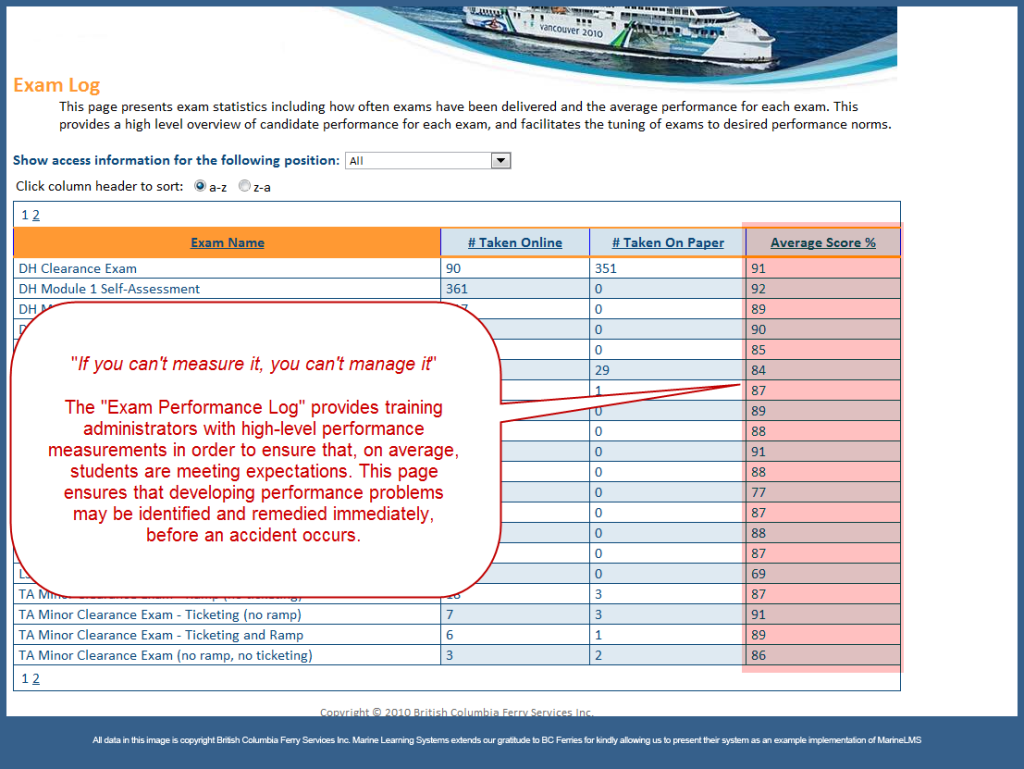
Exam Performance Log
Typically, the LMS will tell you the average score that trainees have been getting on each exam. This allows you to “keep your fingers on the pulse” of assessment performance.
It is a useful audit metric that can be tracked over time to watch for increases or decreases. Variations must be examined carefully since they could be due to a number of factors including: changes in the level of knowledge of incoming candidates, changes in the exams, changes in trainer performance, changes in training curriculum, etc. Numbers which are too high or too low indicate a problem with training or assessment and must be dealt with.
Self-test metrics
Most learning management systems include self-evaluation. Self-tests are typically automatically graded, but no grade is recorded and the trainee is not evaluated on them. Instead, they are used as a formative tool by the trainee to determine whether they possess the knowledge required to go on to the next module or exam.
Since self-tests are used for a different purpose than summative assessments (“final” exams to test competency), their corresponding metrics also differ. Summative assessment metrics tell us whether the trainee learned the material. Self-test metrics tell us how quickly the trainees learned the material.
With self-tests, trainees typically review the learning materials, and when they believe they know it reasonably well, they take the self-test to validate their belief. If their scores are adequate, they move on to the next section. If the score is low, they review the learning materials and then re-attempt the test. This latter situation will create a lower average score on the self-tests.
Keep in mind that self-test scores are relative – they can only be examined by comparing them to either past experience, or to experience on different self-tests. There is no specifically desirable range for self test scores to fall into, though very high or very low scores are problematic for obvious reasons. However, self test scores which change significantly, or self test scores for a program which are much lower than the average of other programs should be investigated.
Conclusion
In general, a learning management system will provide far deeper insight into the efficiency and effectiveness of our training program. These metrics can highlight shortcomings in training which can lead to safety or operational problems. This is one of the benefits of LMSs which have made them become more common within the maritime industry.
Having said that, most vessel operators do not yet employ an LMS in training. Until they do, there are still some excellent KPIs which can be tracked and analysed as indicated in the second article of this series. Start there, and eventually you can make your way here.
# # #
Let us write about your story so we can all learn from it! Is your organization leading the way in job and familiarization training? I’d like to write about it. Or, do you have an example of a poor familiarization experience that we can all take lessons from? I would like to write about that too (without naming you or your company, in this case). Contact me by email. You have a familiarization tale to tell. You can benefit everyone by sharing it.
Follow this Blog!
Receive email notifications whenever a new maritime training article is posted. Enter your email address below:
Interested in Marine Learning Systems?
Contact us here to learn how you can upgrade your training delivery and management process to achieve superior safety and crew performance.